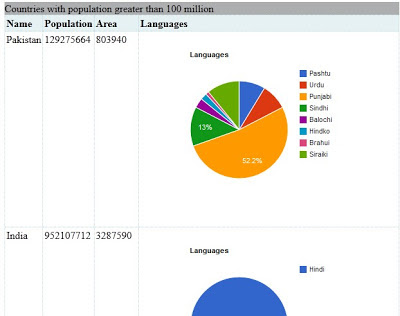
XQuery used on countries XML data.
import module namespace http = "http://expath.org/ns/http-client";

declare %an:sequential function local:doc($href as xs:string) {
  http:send-request(<http:request href="{$href}" method="GET" />)[2]
};


let $doc := local:doc("http://prod-c2g.s3.amazonaws.com/db/Winter2013/files/countries.xml")
let $bigCountries := $doc/countries/country[@population > 100000000 and exists(language)]

return
<html>
  <head>
    <title>Visualization of languages for countries with population greater than 100 million</title>
    <meta http-equiv="Content-Type" content="text/html; charset=UTF-8"> </meta>
    <style type="text/css">
      table {{
        border-collapse: collapse;
      }}
      caption {{
        background-color: #ADAEAF;
        text-align: left;
      }}
      .header {{
        background-color: #E6F1F3;
      }}
      td, th {{
        border: 1px dotted #B3D4DB;
        padding: 2px;
        vertical-align: top;
        text-align: left;
      }}
    </style>
    <script type="text/javascript" src="https://www.google.com/jsapi"> </script>
    <script type="text/javascript">

      // Load the Visualization API and the piechart package.
      google.load('visualization', '1.0', {{'packages':['corechart']}});

      // Set a callback to run when the Google Visualization API is loaded.
      google.setOnLoadCallback(drawCharts);

      function drawChart(percentages, countryName) {{
        // Create the data table.
        var data = new google.visualization.DataTable();
        data.addColumn('string', 'Country');
        data.addColumn('number', 'percentage');
        data.addRows(percentages);

        // Set chart options
        var options = {{'title':'Languages',
                       'width':400,
                       'height':300}};

        // Instantiate and draw our chart, passing in some options.
        var chart = new google.visualization.PieChart(document.getElementById(countryName));
        chart.draw(data, options);
      }}

      function drawCharts() {{
        {
           for $country in $bigCountries
           let $data := string-join(for $lang in $country/language return concat('["', data($lang), '",', data($lang/@percentage), ']'), ',')
           return concat('drawChart([', $data, '],  "', data($country/@name),'");
')
        }
      }}
    </script>
  </head>
  <body>
    <table>
      <caption>Countries with population greater than 100 million</caption>
      <thead>
        <tr class="header">
          <th>Name</th>
          <th>Population</th>
          <th>Area</th>
          <th>Languages</th>
        </tr>
      </thead>
      <tbody>
        {
           for $country in $bigCountries
           order by count($country/language) descending
           return
             <tr>
               <td>{data($country/@name)}</td>
               <td>{data($country/@population)}</td>
               <td>{data($country/@area)}</td>
               <td><div id="{data($country/@name)}"></div></td>
             </tr>
        }
      </tbody>
    </table>
  </body>
</html>
Result from executing XQuery on Zorba
<html>
  <head>
    <title>Visualization of languages for countries with population greater than 100 million</title>
    <meta http-equiv="Content-Type" content="text/html; charset=UTF-8"/>
    <style type="text/css">
      table {
        border-collapse: collapse;
      }
      caption {
        background-color: #ADAEAF;
        text-align: left;
      }
      .header {
        background-color: #E6F1F3;
      }
      td, th {
        border: 1px dotted #B3D4DB;
        padding: 2px;
        vertical-align: top;
        text-align: left;
      }
    </style>
    <script type="text/javascript" src="https://www.google.com/jsapi"> </script>
    <script type="text/javascript">

      // Load the Visualization API and the piechart package.
      google.load('visualization', '1.0', {'packages':['corechart']});

      // Set a callback to run when the Google Visualization API is loaded.
      google.setOnLoadCallback(drawCharts);

      function drawChart(percentages, countryName) {
        // Create the data table.
        var data = new google.visualization.DataTable();
        data.addColumn('string', 'Country');
        data.addColumn('number', 'percentage');
        data.addRows(percentages);

        // Set chart options
        var options = {'title':'Languages',
                       'width':400,
                       'height':300};

        // Instantiate and draw our chart, passing in some options.
        var chart = new google.visualization.PieChart(document.getElementById(countryName));
        chart.draw(data, options);
      }

      function drawCharts() {
        drawChart([["Hindi",30]],  "India");
        drawChart([["Japanese",100]],  "Japan");
        drawChart([["Pashtu",8],["Urdu",8],["Punjabi",48],["Sindhi",12],["Balochi",3],["Hindko",2],["Brahui",1],["Siraiki",10]],  "Pakistan");
        drawChart([["Russian",100]],  "Russia");
      }
    </script>
  </head>
  <body>
    <table>
      <caption>Countries with population greater than 100 million</caption>
      <thead>
        <tr class="header">
          <th>Name</th>
          <th>Population</th>
          <th>Area</th>
          <th>Languages</th>
        </tr>
      </thead>
      <tbody>
        <tr>
          <td>Pakistan</td>
          <td>129275664</td>
          <td>803940</td>
          <td>
            <div id="Pakistan"/>
          </td>
        </tr>
        <tr>
          <td>India</td>
          <td>952107712</td>
          <td>3287590</td>
          <td>
            <div id="India"/>
          </td>
        </tr>
        <tr>
          <td>Japan</td>
          <td>125449704</td>
          <td>377835</td>
          <td>
            <div id="Japan"/>
          </td>
        </tr>
        <tr>
          <td>Russia</td>
          <td>148178480</td>
          <td>17075200</td>
          <td>
            <div id="Russia"/>
          </td>
        </tr>
      </tbody>
    </table>
  </body>
</html>
So what does this page look like in a browser?

No comments:
Post a Comment